

Ziggma is an advanced portfolio tracker developed by professional financial analysts to enhance your investment strategy. Unlike many top portfolio trackers, Ziggma introduces innovative features that deepen your understanding of your portfolio. It offers exclusive tools like custom Stock Scores, Model Portfolios, and a unique Stock Simulator.
Rather than limiting insights to basic sector and geographical breakdowns, Ziggma provides comprehensive metrics such as Beta Risk Factor, Carbon Footprint, and Revenue Growth rate. This positions Ziggma as a cutting-edge portfolio management and investment research platform, crafted for independent investors.
By connecting their portfolios to Ziggma, clients gain access to in-depth insights into portfolio quality, allocation, risk, and investment income. Ziggma facilitates the consolidation of multiple investment portfolios into a single view, ensuring clients have complete control. Through the combination of intelligent portfolio tracking and proprietary algorithm-driven fundamental stock research, Ziggma empowers clients to manage all their investments efficiently from one platform.
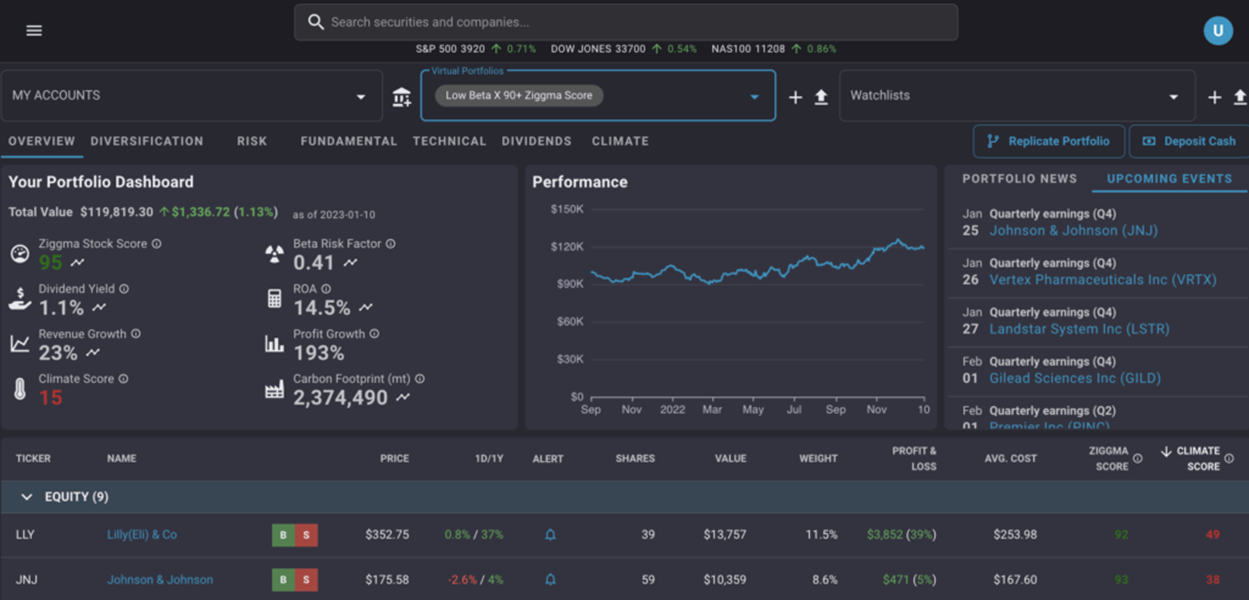
Ziggma Portfolio
Ziggma Portfolio Tracker
The primary function of Ziggma’s platform is portfolio analysis, and I’m happy to report that it excels in this area. You have the option to create unlimited portfolios within the platform or import a virtual portfolio directly from almost any bank or broker via Plaid, ensuring secure account aggregation. Additionally, you can import watchlists from Yahoo Finance.
If you struggle to keep track of multiple investment accounts across different providers, Ziggma is a game-changer. It streamlines portfolio management by offering a comprehensive overview of all your investments in one place.
Upon consolidating your portfolios in Ziggma, the portfolio overview tab provides a snapshot of all key data on a single screen. The dashboard offers a quick summary of:
- Ziggma Stock Score
- Portfolio Yield
- Portfolio Risk (beta)
- Return on Assets (ROA)
- Revenue and Profit Growth
- Climate Score
The Overview section also displays your portfolio’s historical performance, news related to individual stocks, and a detailed table with information on each stock’s weight, number of shares, Profit and Loss (P&L), and Ziggma scores.
In the “Diversification” tab, you can visualize how your portfolio risk is distributed across individual companies, sectors, Ziggma score tiers, asset classes, and countries. For a comprehensive comparison, check out my StockMarketEye review to see how this platform measures up against Ziggma.
Other tabs provide top-level insights into key portfolio metrics such as:
- Risk: Historical aggregate portfolio beta and individual stock beta
- Fundamental: Dividend yield, P/E, ROE, margins, and growth on both a portfolio and stock level
- Technical: Historical price changes, RSI, and MACD for every stock
- Dividends: Portfolio-wide yield and projected 12-month dividend income
- Climate: Climate score and emissions trends for the portfolio
Premium users gain access to a portfolio simulator, demonstrating the impact of potential trades by adjusting characteristics like the P/E ratio. Overall, the Portfolio tools give a comprehensive overview of your current investment status. However, I would appreciate more fundamental charts to visualize changes in valuation or profitability metrics over time.
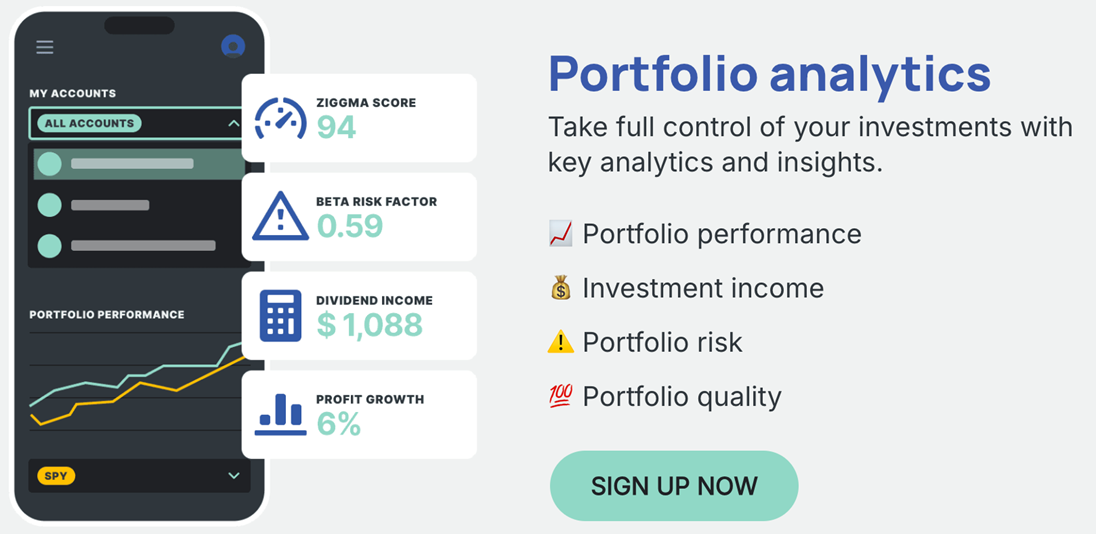
Ziggma Portfolio Dashboard
The Ziggma Portfolio Dashboard stands out with unique data metrics not commonly found in other broker tools or portfolio trackers, such as Revenue Growth, Beta Risk Factor, ROA, Climate Score, and Carbon Footprint. For certain long-term investors, Ziggma already proves its worth.
Not visible in the image above are Ziggma Smart Alerts, which allow investors to set triggers for alerts when specific prices, P/E ratios, or other metrics reach predetermined levels on any stock. This feature is invaluable for long-term investors who prefer not to monitor their portfolios daily.
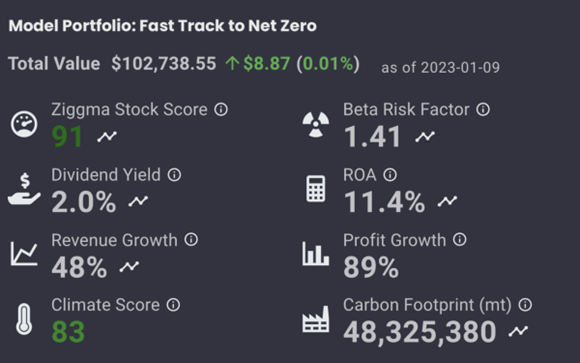
Ziggma Model Portfolios
For those seeking inspiration, Ziggma offers two types of model portfolios.
The Guru Portfolios showcase the top 10 holdings from 13 internationally esteemed investors. To explore these investment strategies, you might find articles on Martin Zweig, Peter Lynch, and William O’Neil’s CANSLIM strategy insightful.
Ziggma’s Model Portfolios are custom-crafted by their in-house analysts, presenting 12 different options aimed at various investment themes such as Sustainability, Profitable Growth, High Yield, Low Beta, and Best-in-Class REITs, among others. By selecting any portfolio, you can see a comprehensive list of included stocks and employ all the portfolio tools previously mentioned.
These in-house Model Portfolios reflect a wide array of investment strategies, including growth, value, low volatility, high yield, and climate-focused approaches, to meet diverse investor needs.

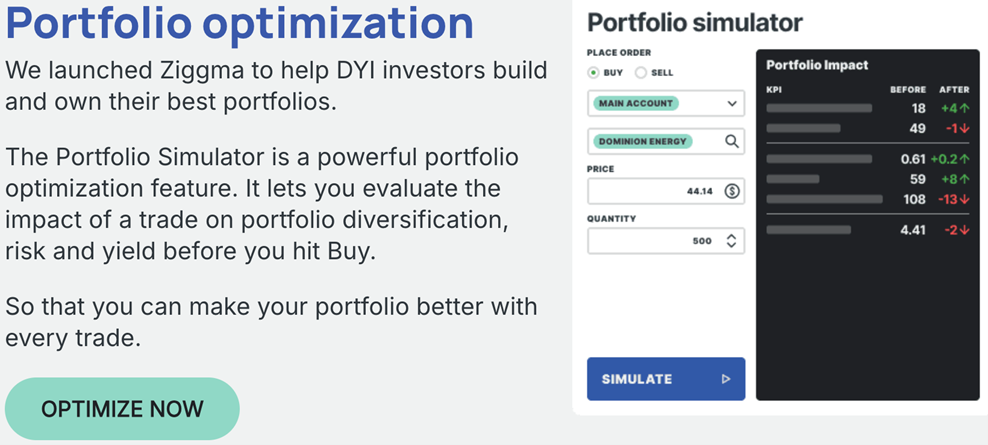
Portfolio Simulator
Ziggma’s Portfolio Simulator allows you to gauge the impact a trade will have on your portfolio. This enables you to see how a trade will affect your portfolio split, average yield or growth.

The Portfolio Simulator is another great example of how Ziggma’s team leverages its experience in institutional finance and its willingness to create brand-new features for the benefit of individual investors.
Ziggma Stock Screener
Ziggma offers a free stock screener that simplifies the search for outstanding stocks by allowing users to filter based on standard financial metrics like P/E, P/S, and Dividend Yield, as well as unique data points such as Stock Score and Carbon Footprint.
While Ziggma’s stock screener is quite straightforward, it provides 36 metrics for stock filtering, including:
- Valuation: Market Cap, P/E, P/B, Dividend Yield, EV/EBITDA
- Growth: Current, Forward, and 5-Year CAGR Revenue & EPS Growth
- Profitability: ROE and Net Margin both currently and on a 5-Year average
- Financial Position: Debt/Assets, Net Debt/EBITDA, Current Ratio, EBIT/Interest Expense
- Climate/Technical: Climate Score, Carbon Intensity, RSI, 52-week High/Low, Beta
- Ziggma Score: proprietary scoring system based on over 40 KPIs, available to premium subscribers
For those seeking screening inspiration, Ziggma offers pre-configured screens targeting stocks within various sectors and growth categories. And if you’re interested in conducting your own sector and industry-specific screenings, the drop-down menus allow you to focus on particular sectors.
Additionally, Ziggma provides an ETF screener that enables filtering within a comprehensive database of over 3000 ETFs, covering multiple asset classes, issuers, and sectors. The ETF screener, although limited, includes filters like:
- Yield
- Expense Ratio
- Beta
- Assets
While the stock screener may seem basic, it effectively complements Ziggma’s core portfolio management tools. The standout feature is Ziggma’s proprietary scoring system, which, if appreciated for its Big Data approach to fundamental analysis, can enhance the stock selection process.
Instead of exhaustive dropdowns filled with less commonly used financial ratios, Ziggma prioritizes qualitative measures to simplify stock research.

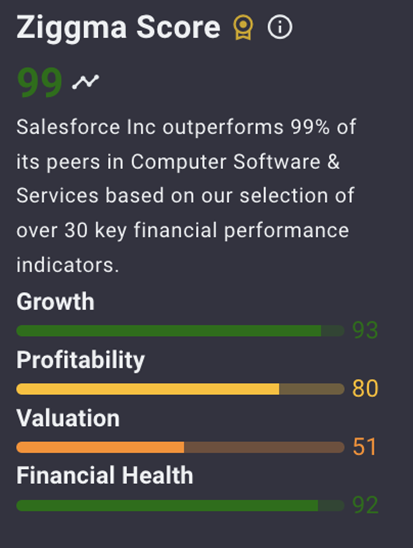
Ziggma’s Stock Research is arguably its most popular feature, though you might not realize its appeal until you try it. While stock screening and portfolio management are excellent for top-down analysis, comprehensive investment processes require effective bottom-up stock research. Fortunately, Ziggma provides this.
Every company on Ziggma has its own profile page, offering detailed insights to help you assess their prospects in depth. These profiles include:
- Overview of the Ziggma score
- Stock price charts powered by TradingView
- A list of company strengths and weaknesses
- Forecasted revenue and EPS growth for the current and next fiscal years
- Trends and charts for valuation, growth, and profitability ratios
- Industry-specific KPIs
- Latest news updates
- Peer comparison tools
- Financial statements from the past five years along with the latest SEC filings
- Insider transaction data
- Carbon footprint metrics
The strengths and weaknesses section provides a concise overview of a stock’s benefits and challenges, making it a great starting point for your research. You can also examine recent trends in industry-specific financial ratios and accounting measures, with the option to toggle between annual and quarterly data.
If you’re interested in seeing how a company measures up against its peers, the Peer Comparison tool is invaluable, allowing you to compare recent performance, P/E ratios, EPS growth, and other relevant industry metrics among peers.
Ziggma’s stock research tools are reminiscent of Finviz’s platform, so if you’re curious about alternative research tools, you might find my Finviz review helpful.
Although Ziggma is primarily recognized as a portfolio management software, its unique feature of listing strengths and weaknesses for each stock is my favorite aspect.
The research data is well-organized into categories like growth, valuation, profitability, and financials, allowing you to easily switch between annual and quarterly data. Ziggma covers all securities listed on the NYSE and Nasdaq.
Ziggma Plans & Fees
Ziggma offers both a Free Plan and a Premium Plan.
With the Free Plan, you can access excellent features like the Portfolio Dashboard and the Ziggma Stock Screener at no cost.
By upgrading to the Premium Plan, you can unlock advanced capabilities such as Smart Alerts and Stock Scores.

Ziggma Smart Alerts
Smart Alerts notify you when a specific metric reaches a predetermined threshold. Just define the event that will trigger an alert, and receive buy and sell signals effortlessly. You can set alerts for several criteria, including:
- Price
- P/E ratio
- Dividend Yield
- Beta
- Volatility
- RSI
- MACD
For example, you can establish a target price at which you’d like to sell a stock. Alternatively, if there’s a stock on your watchlist that is currently too pricey, set a P/E or dividend yield target that matches your buying criteria. You’ll be immediately informed when the stock’s valuation aligns with your expectations.

KPI Trends
A helpful method for monitoring KPI trends is to navigate to the “Fundamental” tab of any portfolio. Here, you’ll find a table displaying key performance indicators, with their current values alongside the original values from when you first acquired the stock. The original KPI values are shown in grey beneath the current values. Numbers in red signify a decline in KPIs since purchase, white numbers indicate no change, and green numbers highlight improvements.
This visualization is particularly beneficial for identifying which stocks are progressing positively and which aren’t. It’s especially valuable for managing large portfolios, where manual tracking can be nearly impossible.
Backtesting
Ziggma provides a backtesting feature for premium members, but I found it somewhat underwhelming. It primarily simulates the historical performance of an existing portfolio. Unlike most backtesting tools, it doesn’t allow you to set buy and sell rules for periodic rebalancing. This limitation means you can’t truly evaluate whether a specific investment strategy is effective. Therefore, labeling it as a backtester seems a bit exaggerated; it’s more accurately described as a performance chart for a collection of stocks.
Broker Integrations
Through their partnership with Plaid, Ziggma connects with thousands of banks and brokers across the U.S. This integration allows you to import your 401k, IRA, or other portfolios, regardless of where they are held.
Among the connected institutions are:
- Robinhood
- Charles Schwab
- TD Ameritrade
- Chase
- Fidelity
- Interactive Brokers
- And many others
It’s important to note that Ziggma is not a brokerage or trading platform, meaning you cannot place orders directly within Ziggma.
- Free stock screener and portfolio management tools
- Innovative climate impact metrics
- Guru and model portfolios for idea generation
- Data-driven stock scoring system
- Smart alerts and KPI tracking for position monitoring
- User-friendly interface
- Excellent value for investment management
- Limited filters in the stock screener
- Weak backtesting capabilities
- Lack of specific features
- Insufficient data availability
- Limited options for users
- Poor customer support, with slow communication
This Ziggma review showcased the core features behind this user-friendly, yet highly effective portfolio management platform. The portfolio tracking tools help consolidate your investments in one location, giving you a 360-degree view of your entire financial situation.
Moreover, the numerous research tools help with idea generation and bottom-up analysis of individual stocks.
The Ziggma stock scores are particularly unique, providing users with institutional-grade quantitative analysis.
Where Ziggma slightly disappoints is on stock screening and backtesting. However, given these are ancillary features to the core portfolio management tools, it doesn’t take away from the overall experience in my view.


