Tradervue revolutionizes the trading journal concept by offering a powerful combination of in-depth analysis tools and a vibrant social platform specifically designed for traders. It’s more than just logging your trades, it’s a comprehensive ecosystem that empowers you to dissect your performance, connect with like-minded individuals, and elevate your trading game.
Unleash the Power of Deep Dives: Tradervue goes beyond basic journaling. It provides a robust suite of tools for analyzing your trading behavior. Evaluate your entries and exits, pinpoint recurring mistakes, and identify patterns that might be influencing your profitability. This level of granular detail allows you to gain a deep understanding of your strengths and weaknesses as a trader.
The Power of Community: Tradervue isn’t just about self-analysis it’s about fostering a supportive community. Connect with fellow traders, share your experiences (both successes and failures), and gain valuable insights from others’ perspectives. This collaborative environment fosters accountability, keeps you motivated, and exposes you to a wealth of trading knowledge you won’t find anywhere else.
Tailored for All Levels: Whether you’re a seasoned veteran or a new trader just starting out, Tradervue caters to your needs. The intuitive interface makes it easy to use, while the advanced features provide powerful insights for experienced traders. It’s a one-stop shop for traders of all levels who are serious about taking their performance to the next level.
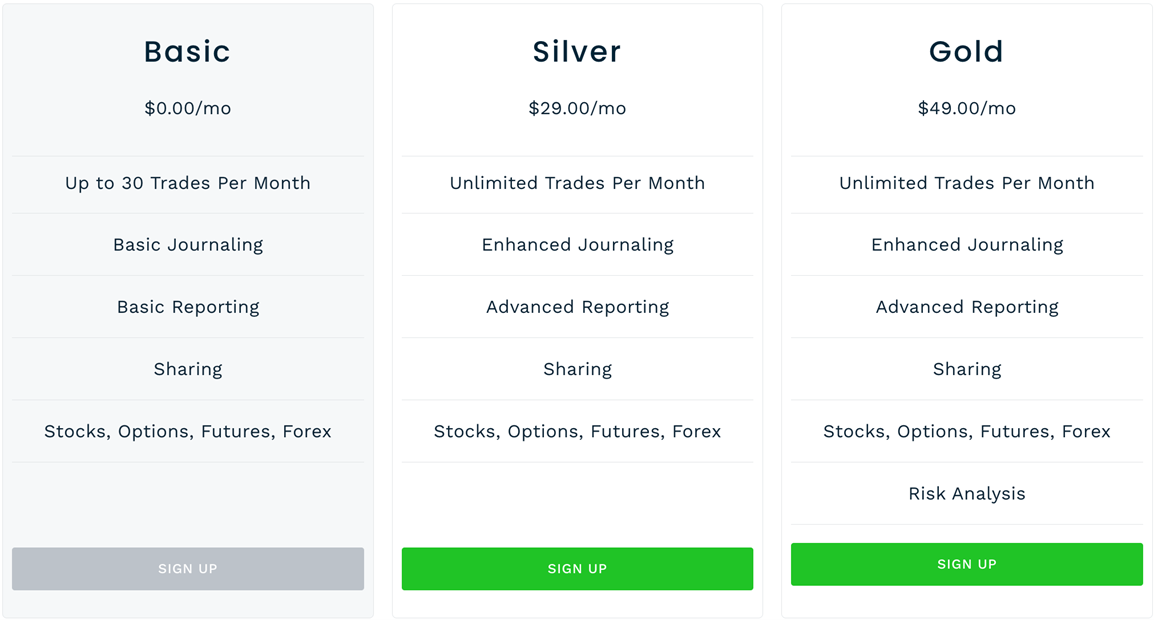
TraderVue Basic:
Price: Free
Tradervue’s Basic plan is completely free and offers an impressive amount of functionality compared to most free trade journals. There are important features only available with a paid plan, but traders looking for a basic, sharable trading journal will likely be happy with the free plan.
Here is what is offered in the free plan:
- Log 30 stock trades per month
- Journaling tools
- Basic reports
- Sharing
Tradervue Silver:
Price: $29/month
Tradervue’s Silver plan is where you begin to get some of the platform’s proprietary journaling tools, plus the ability log unlimited trades.
Here is what is offered in the Silver plan:
- Unlimited trade entries
- Enhanced journal tools
- 100+ advanced reports
Tradervue Gold:
Price: $49/Month
The Gold plan is Tradervue’s most expensive plan. The main difference between Silver and Gold is the addition of risk analysis tools in the Gold plan. It also offers more reports, more cloud storage, and exit analysis.
Here are the Gold plan’s offerings:
- Unlimited trade entries
- 300+ advanced reports
- Risk analysis
- Exit analysis
- Commission analysis
| Basic $0/mo | Silver $29/mo | Gold $49/mo | |
| Number of trades | 30/month | unlimited! | unlimited! |
| Trade import from brokers | ✓ | ✓ | ✓ |
| Stocks and ETFs | ✓ | ✓ | ✓ |
| Automatic price charts on multiple timeframes | ✓ | ✓ | ✓ |
| Entries/exits shown on price charts | ✓ | ✓ | ✓ |
| Tagging and filtering | ✓ | ✓ | ✓ |
| Overview reports | ✓ | ✓ | ✓ |
| Detailed reports | ✓ | ✓ | ✓ |
| Dashboard | ✓ | ✓ | ✓ |
| Share trades with community | ✓ | ✓ | ✓ |
| Futures support | ✓ | ✓ | ✓ |
| Forex support | ✓ | ✓ | ✓ |
| Options support | ✓ | ✓ | ✓ |
| Intraday and running P&L charts | ✓ | ✓ | |
| Renko, Volume Bar, and Range Bar charts | ✓ | ✓ | |
| MFE/MAE statistics | ✓ | ✓ | |
| Interactive drill-down reports | ✓ | ✓ | |
| Advanced reports | more than 100! | more than 300! | |
| Multiple independent trading accounts | ✓ | ✓ | |
| Download/Export to Excel | ✓ | ✓ | |
| Image uploads and storage | 1 GB | 5 GB | |
| Mentoring | ✓ | ✓ | |
| Price chart studies and comparisons | ✓ | ✓ | |
| Adjust auto-merge and auto-split settings | ✓ | ✓ | |
| Include P&L data with shared trades | ✓ | ✓ | |
| Selectable base currency | ✓ | ✓ | |
| Risk tracking and reporting | ✓ | ||
| Advanced Filters | ✓ | ||
| Exit analysis | ✓ | ||
| Commission and fee support | ✓ | ||
| Liquidity reports | ✓ |
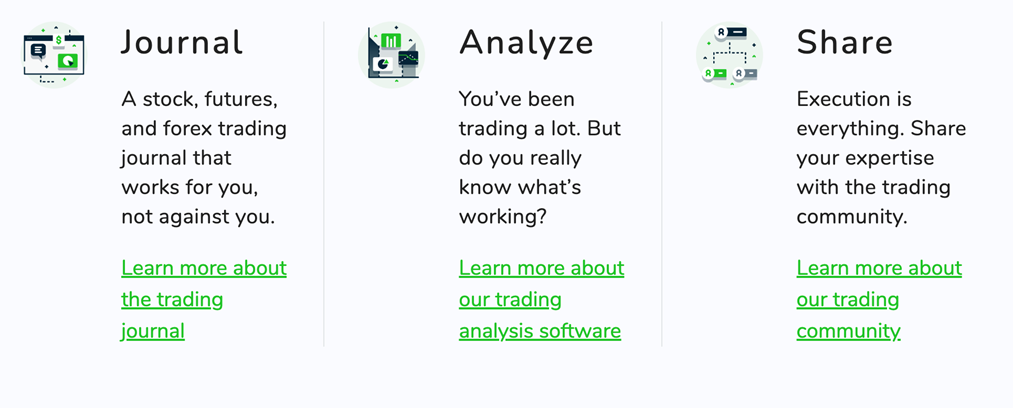
A trading journal is one of the best ways to improve your trading and Tradervue is the most powerful tool available to keep your journal.
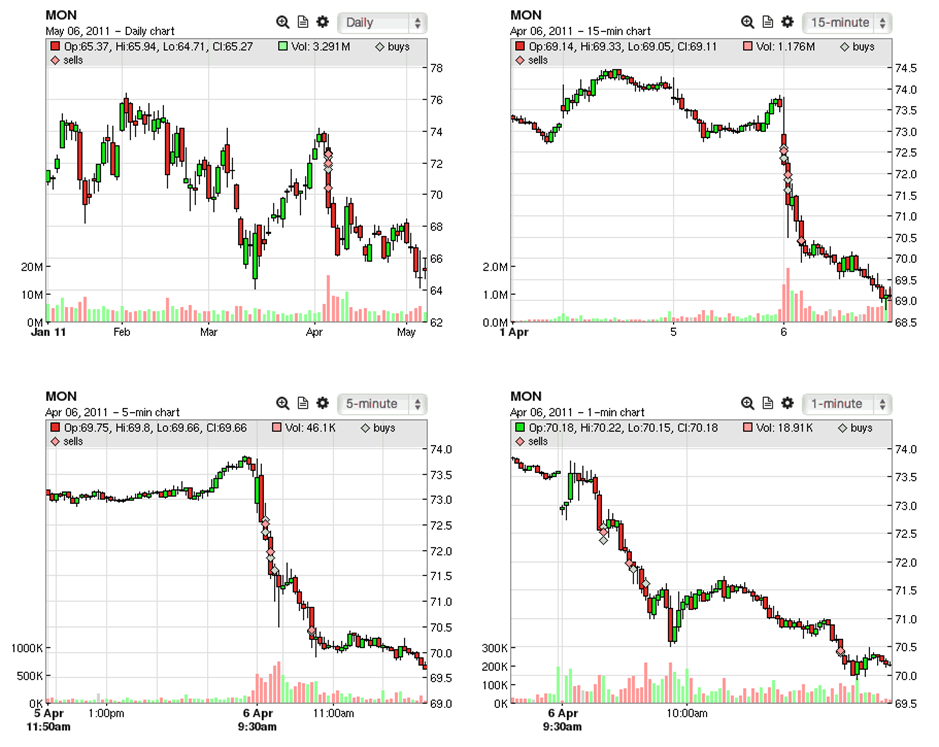
- Automatic Price Charts When you record a trade in your journal, charts on multiple timeframes (from weekly down to 1-minute) are available for your review. You’ll even see your buy/sell points marked on the charts, even for trades years in the past.
- Daily Notes: Make notes about the trading day as a whole, even for days you didn’t make any trades. The Journal View conveniently groups trades and related notes by day.
- Dashboard: A summary of the day, a recap of the last week’s trading performance, activity on your recent shared trades, and even pointers to trades others have shared in the same instruments you were trading on the last couple of days.
- Chart Studies: See the same chart studies (moving averages, bollinger bands, ATR, etc.) that you use during the trading day, or add comparison charts with an index, sector, or another security.
- Running P&L Charts: View your trade’s P&L over time. And for intraday trades, see your running combined P&L for the whole trading day, highlighting where a specific trade fit into the day.
- Multi-Currency: Trades settled in other currencies (e.g. forex, Eurex, etc.) will calculate P&L data and statistics both in their native currency, and in the base currency (USD) for aggregate reporting with other trades.
- Commissions and Fees: Track commissions and fees, and switch the reports to use either gross or net calculations based on your preference.
Trading analysis software built to objectively improve your trading performance.
- Overview Reports: See recent performance at a glance, including daily and cumulative P&L, volume, and win %, to spot recent trends. And drill down into results by year, by month, and by day.
- Detailed Reports and Statistics: Dig deep into your performance to really understand your trading. Calculate results based on symbol, price, volume, day/time, market movement, instrument behavior, and many more.
- Comparison Reports: Compare winning days with losing days, longs vs. shorts, breakout vs. support trades (using tags), this month vs. last month, or choose any two sets of trades that you define.
- Advanced Reports: See your trades plotted in fine detail by the trade duration, day/time, P&L, volume, or many other measures. Choose the specific data to plot on each axis for hundreds of possible combinations.
- Tick-based Reports: Run any reports for futures trades based on either return in USD, or in ticks – even if you’re trading multiple instruments.
- Risk Analysis: Analyze your performance in terms of risk, or R multiples. Even if you risk different amounts on every trade, the R-based reporting will give you an understanding of your risk-adjusted performance.
- Liquidity Reports: Analyze your trading performance relative to whether you’re adding or removing liquidity, even broken up by entry and exit shares. Essential data for the active intraday equity trader.
You can import trading data into Tradervue automatically from most major brokerages and trading platforms. You can also import a spreadsheet with trade data or enter trades manually.
Tradervue automatically generates charts for multiple timeframes and marks your trade entries and exits on them. This makes it much easier to look back at trades and remember the setup you were trading.
These automatic price charts save you from having to switch between your trade journal and charting platform when you want to visualize your past trades on a chart. It can also be helpful to see your trades plotted across charts so you can better understand what you did right and wrong.
Tradervue allows you to add custom notes to every trade. This is great if you want to record your thinking going into a trade, how you were feeling that day, what setup you were pursuing, and more. You can also make notes about an entire trading day, which is a great opportunity to reflect on how your trades went.
You can also add tags to any of your trades, which is really useful for noting whether a trade was based on a specific setup. Tags can also be used to categorize your emotions or mindset during a trade or to provide granular detail about sub-industries you like to trade.
Tradervue makes it simple to filter trades by symbol, trade type (long or short), trade duration, date range, and trade tags.
Having the ability to quickly sort your historical trades is crucial. All types of trends can be found within this data.
You might find, for example, that no matter what type of trade you take, you can’t make money in the S&P E-mini futures, but you have a very positive expected value in soybean futures. Or you might find that you’re terrible at trading futures altogether and if you stuck to stocks, you could increase your trading performance two-fold.

Trade analytics lies at the heart of Tradervue’s functionality. The data analyses this platform offers can help you recognize trends in your trading history and make changes to increase your profits.
Here is an example report:

The reports summarize key data related to your trading. You can get statistics on:
- Average gains
- Average losses
- Win/loss rate
- Win/loss streaks
- Average holding periods
- Money spent on commissions
You can filter all of this data down by day of the week, stock type, and more. So, it’s easy to dig into your trades and slice up your data in whatever way makes sense to you.
These reports can be incredibly insightful for active traders. You probably have a good understanding of your overall P&L, but it’s hard to pay attention to other trends that may impact your profitability.
For example, you might discover that you have a win rate of 75%, but your overall profitability is impacted by major losses that exceed your average profit. You might also find that you trade poorly on certain days of the week or during certain hours of the day.
Tradervue keeps track of the profit and loss on trades based on the tags you create. If you use TraderVue properly label all of your trades, it’s amazing how quickly you can spot trends in your trading and make actionable changes to your strategy.
In the example report below, it’s clear that the trader makes the majority of their profits with momentum trading. So, they can act on this data by focusing exclusively on momentum trades and cutting out other types of trades.

Tradervue offers hundreds of different reporting tools, many plotting your trades on a simple x-y chart. In the example below, you can see how the software plots trade duration against profit and loss.

This particular trader doesn’t exhibit a strong relationship between trade duration and profit. However, it’s easy to envision a scenario where there’s a clear correlation between profitability and a controllable factor like what time of day you trade.
A great way to learn, get feedback, and grow your trading. Share trades with the best trading community out there. Try Tradervue for free.
- Share Trades: Tell people why you got into that trade, what your plan was, and whether you followed your plan. Trade didn’t work out? Share that too! Not every trade is a winner; help others learn from your trade, and learn how great traders get out of their losing trades.
- Privacy First: You choose which (if any) trades you share. Sensitive information like your P&L and your share volume is excluded from the shared trade. Just your notes, your buy and sell points, and the charts you select are shared – share everything that’s educational, and nothing that’s too personal.
- Find Others: If someone else has shared a trade in a symbol that you were also trading, you’ll find out about it right on your dashboard. Compare notes!
- Share P&L if you choose: By default, shared trades in Tradervue are shared without volume and P&L information. However, if you prefer to share trades with your P&L and volume, you have that option. It’s up to you!
Tradervue makes it easy to share your trades with other users. You can explain your rationale behind a trade and detail your plan. You can also celebrate when a trade goes well, and reflect when a trade goes poorly.
You can decide to make any trade private, which is nice if you don’t want to share certain positions. It’s also up to you to decide whether you want to share profit and loss details for each trade or not.
The social aspect of trading can be a double-edged sword. While it’s great to hold yourself publicly accountable, it’s important not to get too caught up in what other traders are doing. Too many traders want to try on everyone else’s trading styles instead of sticking to their niche.

TraderVue doubles as both a trading journal and a social media platform. It allows you to share your trades with the entire TraderVue community, meaning you will carefully think through trades. Discover if this trading journal could work for you.
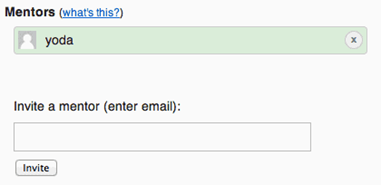
TraderVue allows you to give coaches or mentors access to your journal. This is really helpful if you have a coach or are thinking about getting one. An experienced trader can quickly spot trends in the journal data can plug leaks in a trader’s strategy.
Tradervue supports a wide variety of brokers and trading platforms ( 100+); and even if your broker is not on this list, it’s likely you can still use Tradervue.
- Great built-in reports and analytics
- Charts show entry and exits for every trade
- Competitive pricing with an excellent free plan
- Easy to use web-based platform
- Subscription pricing (other journals charge a one-time fee)
- Reports aren’t highly customizable
- Only two rating reviews on Trust Pilot
- Average rate on trust pilot

Tradervue offers a fantastic free plan that’s perfect for getting your feet wet. Log your initial trades, jot down valuable insights, and leverage the platform’s tagging system to categorize your experiences. This foundation allows you to build confidence and establish a solid trading foundation without any financial commitment. Plus, when you’re ready to take the next step, your historical data seamlessly integrates with upgraded plans, ensuring a smooth transition as you unlock more advanced features.
Simplify Your Analysis: Not everyone enjoys getting bogged down in highly customizable analytics. If you prefer clear, actionable insights, Tradervue shines. Its pre-built reports automatically dissect your performance, highlighting the factors most commonly impacting trader success. This streamlined approach saves you time and effort while providing valuable guidance to improve your trading decisions.
Embrace the Community: Remember, the journey of a trader is rarely solitary. Tradervue’s vibrant community provides a unique advantage. Connect with fellow traders, share your experiences (both victories and lessons learned), and gain valuable insights from diverse perspectives. This supportive environment fosters accountability, keeps you motivated, and accelerates your learning curve as you navigate the exciting world of financial markets.